Getting Started with Power BI
/What is Power BI?
Power BI is a suite of analytics tools that empowers users to consume, analyse and visualise data. Underpinned by the Power BI service (SaaS), authors can publish reports to the cloud and provide users with a number of different channels to consume insights. Whether that be on the web via powerbi.com, on the mobile (iOS or Android), within a 3rd party application (embedded) or via Cortana on Windows 10.
Typical Data-to-Insight Workflow
While the Power BI suite caters for a number of analytic scenarios, a common data to insight workflow would typically consist of two components:
- Power BI Desktop (full client application) to get, model and visualise data.
- Power BI Service (*) as a destination for authors to publish and share content.
(*) Note: The Power BI Service is not limited to content consumption, but also allows content creation (i.e. the authoring of reports and dashboards). To keep things simple though, particularly when just getting started, consider Power BI Desktop as the tool of choice for content creation.

Power BI Family
While we will primarily focus on Power BI Desktop and the Power BI Service, below is a short description for each product within the Power BI suite.
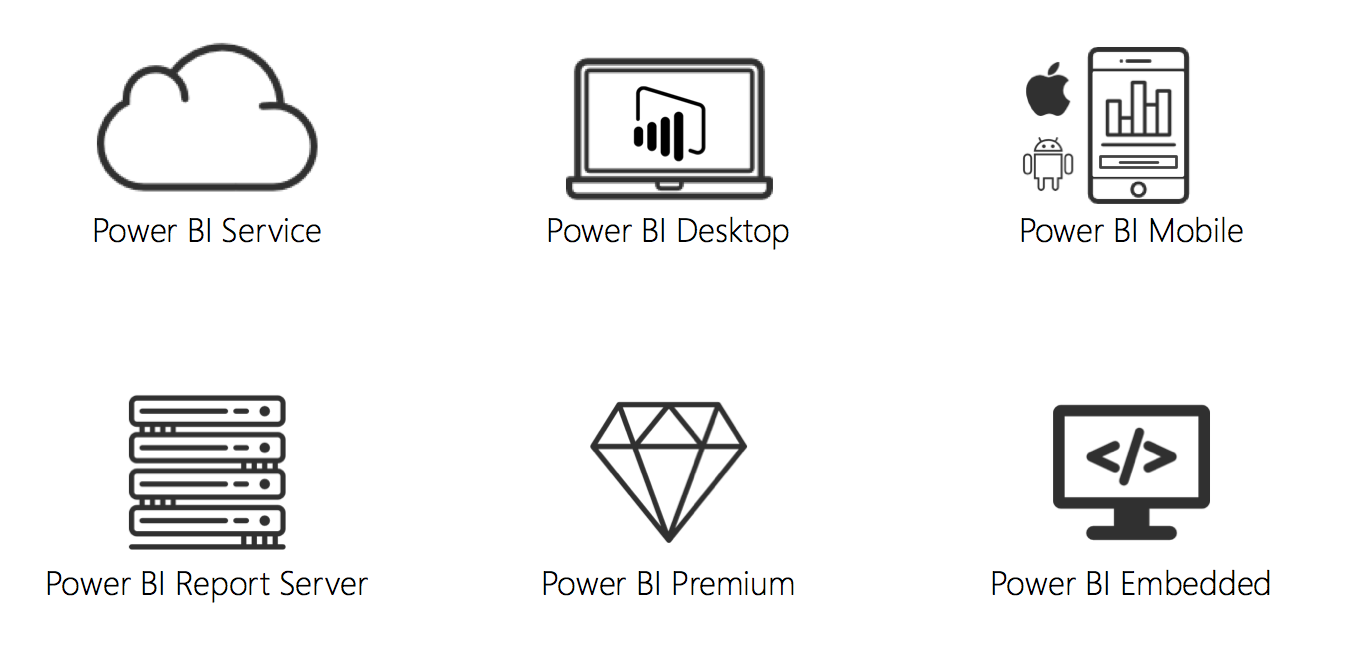
- Power BI Service
Commonly referred to as PowerBI.com, a publicly accessible cloud-based (SaaS) service that underpins Power BI content and enables the creation of dashboards. - Power BI Desktop
A free desktop application that enables content producers to model data and author reports typically without IT involvement. - Power BI Mobile
A set of apps across iOS, Android and Window 10 that enables the consumption of Power BI content on mobile devices. - Power BI Report Server
On-premises (aka self-hosted) offering to serve and create Power BI reports (subset of Power BI service). - Power BI Premium
Dedicated capacity which allows for the distribution of Power BI content without per-user licensing. - Power BI Embedded
Enables ISVs and developers to integrate Power BI content (reports, dashboards and tiles) directly into an application.
Getting Started
Before you can get started, you will need to download and install Power BI Desktop.
- Navigate to https://powerbi.microsoft.com/get-started
- Click "Download Free"
- Install Power BI Desktop
Once Power BI Desktop is up and running on your local machine, you are ready to Get Data (Connect), Model Data, Visualise (Report Authoring) and Publish (save to PowerBI.com).
Demo

The videos walk through an end-to-end demonstration of how to:
- Enrich, transform and model data across disparate sources using Power BI Desktop and Power Query.
- Build an interactive report with out of the box as well as custom visualisations.
- Publish to the Power BI service (i.e. powerbi.com) and an overview of the various features and functions: Quick Insights, Natural Language Query with QnA, Real-Time Streaming, Cortana and more.
To get started simply download the sample data below.
FORMULAS
Add a column to uniquely identify each row prior to appending the queries together
Symbol = "BTC"
Note: Bitcoin = BTC, Bitcoin Cash = BTH, Ethereum = ETH, Ripple = XRP
Convert the Epoch value into a Date/Time
Date = #datetime(1970,1,1,0,0,0)+#duration(0,0,0,[Epoch]/1000)
Create a Date table using DAX
Date = CALENDARAUTO(6)
Date Attributes
Year = YEAR('Date'[Date])
Month = FORMAT('Date'[Date], "Mmm")
Day = DAY('Date'[Date])
GOTCHAS
Forecasting is missing? In Part 2 (Data Visualization and Report Authoring), if you are unable to see the Forecasting section within the Analytics pane, ensure that the [Symbol] column has been removed from the legend in addition to filtering for a specific value (e.g. BTC).